Implementation
Process of Implementation
I implemented my Phase 1 research in one week for a total of 5 days with 3 different micro lessons. I began the first day by introducing the group of students to what they would be doing. Due to limitations in the class, I decided to work with 6 students on this project. They normally work in small groups depending on their ability level during math time. I chose to work with students who I thought would benefit the most from this sort of instruction, while at the same time not splitting up the teams from the math groupings. I sat the students down, and explained that for the week they would be taking a break from their regular math packets, and that they would be working a special project. I introduced the “Early Humans Career” Project and went through what was to be expected of them by the end of the week. One of the students asked, “I thought we were going to be working on math?” Before I had a chance to answer, another responded with, “It is math, but it is the fun kind of math.” I took this as a good sign for how the week was going to go.
I implemented my Phase 1 research in one week for a total of 5 days with 3 different micro lessons. I began the first day by introducing the group of students to what they would be doing. Due to limitations in the class, I decided to work with 6 students on this project. They normally work in small groups depending on their ability level during math time. I chose to work with students who I thought would benefit the most from this sort of instruction, while at the same time not splitting up the teams from the math groupings. I sat the students down, and explained that for the week they would be taking a break from their regular math packets, and that they would be working a special project. I introduced the “Early Humans Career” Project and went through what was to be expected of them by the end of the week. One of the students asked, “I thought we were going to be working on math?” Before I had a chance to answer, another responded with, “It is math, but it is the fun kind of math.” I took this as a good sign for how the week was going to go.
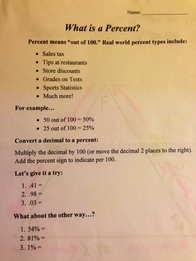
At the start of the second day, I implemented my first micro lesson. This was the worksheet where students began to conceptualize percent, and have conversations about common percentages we work with in our lives. I wanted to connect the concept of percent to them and make it real. The students came up with many ways we use percentages, and even offered some explanations on how to conceptualize this information. On this worksheet, I also explained the initial relationship between percent, fractions, and decimals. Students then had an opportunity to make conversions between the three types of representation. I used common percentages that they would recognize so that they might make a connection between this procedure and the concepts we had discussed. After the micro lesson, students began work on their project. This day was mostly working through researching their career and finding data. This was an important step because the students made connections with what they were about to research. They became excited about their career and about the data they were finding.
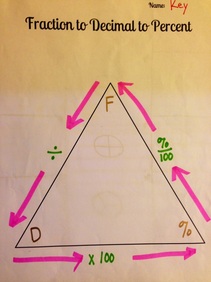
Day three began with the second micro lesson. This lesson dealt with creating a fact triangle between percent, fractions, and decimals. I wanted to show the students even further the connecting relationships between the concepts.
Day three began with the second micro lesson. This lesson dealt with creating a fact triangle between percent, fractions, and decimals. I wanted to show the students even further the connecting relationships between the concepts.
We talked through how they connect, and how we see numbers like 50% as a decimal and a fraction. This lesson also focused on the procedural knowledge of the connections. Using the triangle, I taught the students how to make conversions, and what the conversions would look like when they were made. Students were picking up on how to make these conversions as we went through this lesson.
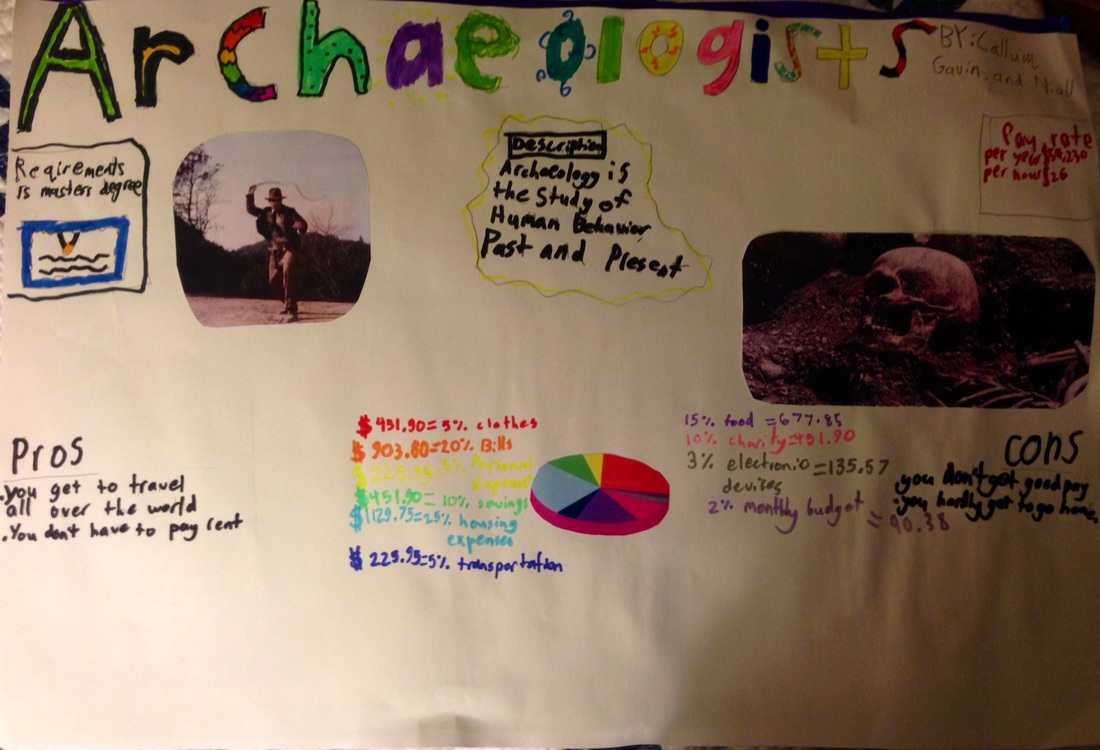
After the fact triangle lesson, the students began making computations on their project. The math inquiry had them looking into finding a salary, and then computing different percentages that they would have to spend through the year. I wanted the students to each do the work individually, but work alongside one another in a group to use each other as assets. They first computed how much money they would make in one month. This involved long division, which in turn used multiplication. I only allowed calculators for students to check their work. After they discovered their monthly income, they would figure out how much they would need to spend on things like housing, transportation food, etc. As students started making the computations, I was noting errors in calculation in some of the multiplication, areas that were challenging, and the parts that students were particularly successful with. The errors were solved through collaboration and the students checking each other’s work. Each group finished about half of the packet by the end of day three.
After the fact triangle lesson, the students began making computations on their project. The math inquiry had them looking into finding a salary, and then computing different percentages that they would have to spend through the year. I wanted the students to each do the work individually, but work alongside one another in a group to use each other as assets. They first computed how much money they would make in one month. This involved long division, which in turn used multiplication. I only allowed calculators for students to check their work. After they discovered their monthly income, they would figure out how much they would need to spend on things like housing, transportation food, etc. As students started making the computations, I was noting errors in calculation in some of the multiplication, areas that were challenging, and the parts that students were particularly successful with. The errors were solved through collaboration and the students checking each other’s work. Each group finished about half of the packet by the end of day three.
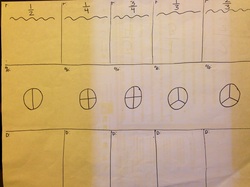
The third micro lesson took place on the fourth day. This lesson involved a foldable that looked at five of the most common fractions: 1/2, 1/4, 3/4, 1/3, and 2/3. The students and I then developed a foldable that demonstrated the counterparts of each fraction in both decimal and percent. At the end, we then shaded in a “pie” to show what the percent would look like. As we worked through this foldable, we focused on talking about the concepts behind the representations. Where do we find ½? What do we use for .25 and .75? I utilized interactive instruction that allowed some great dialogue between the students. By talking in depth and developing this deep learning for the concepts, it allowed ease of use of the procedure to interchange between the percent, decimal, and fraction. After the foldable was created, the students moved into finishing the project of figuring out how to spend their respective salaries. I continued to note on their progress, and allowed them to self-correct and utilize their group members for help.
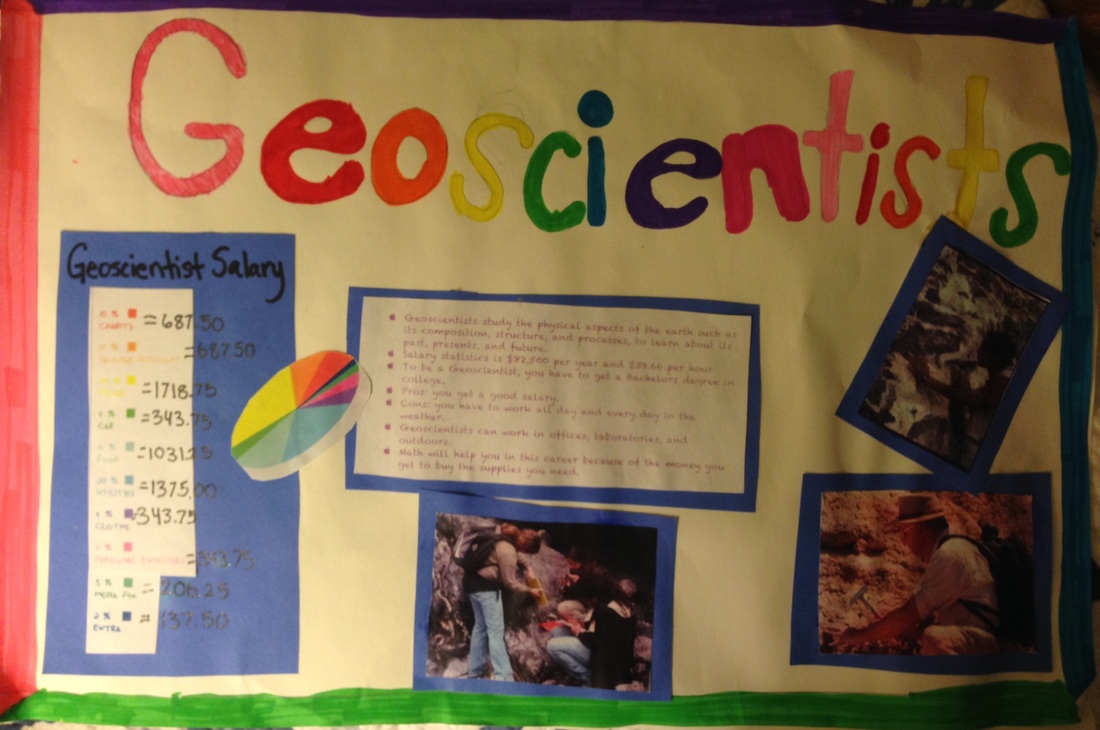
On the fifth and final day, students began looking at and analyzing their data for their presentations. I monitored as students began to notice how all the different ways they spend their salary added up to 100%, or to the total amount of what they would earn in one month’s time. They developed pie charts, gathered the most pertinent data, and then put the information together onto a poster. I had the students present their work, and talk about how different amounts such as 25% or 10% had different impacts depending on what they had to spend their money on. After the presentations were finished, I performed a post test of a similar math inquiry in order to see how they were able to both procedurally and conceptually work with different percent. I used a problem solving inquiry that had the students working with percentages in multi-step problems. Of my 6 students I worked with, 5 were able to finish and correctly solve for the math inquiry.
On the fifth and final day, students began looking at and analyzing their data for their presentations. I monitored as students began to notice how all the different ways they spend their salary added up to 100%, or to the total amount of what they would earn in one month’s time. They developed pie charts, gathered the most pertinent data, and then put the information together onto a poster. I had the students present their work, and talk about how different amounts such as 25% or 10% had different impacts depending on what they had to spend their money on. After the presentations were finished, I performed a post test of a similar math inquiry in order to see how they were able to both procedurally and conceptually work with different percent. I used a problem solving inquiry that had the students working with percentages in multi-step problems. Of my 6 students I worked with, 5 were able to finish and correctly solve for the math inquiry.
|
|
Results
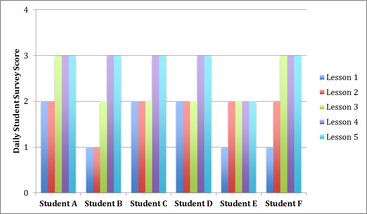
The micro lessons that I utilized were the most successful with my students. Each of the six students was attentive, involved, and working hard during the lessons. Additionally, they were willing to participate in the interactive teaching method that I was implementing. They were responsive in providing answers to the questions I was posing, helpful in sharing their thoughts on the concepts, and motivated to contribute towards the learning environment. During this time, the practice was guided and it was mostly instruction on both procedural and conceptual knowledge. Since there was no independent practice during this portion of the research, I looked towards the project to let me know how well the students were picking up the procedures and concepts.
The micro lessons that I utilized were the most successful with my students. Each of the six students was attentive, involved, and working hard during the lessons. Additionally, they were willing to participate in the interactive teaching method that I was implementing. They were responsive in providing answers to the questions I was posing, helpful in sharing their thoughts on the concepts, and motivated to contribute towards the learning environment. During this time, the practice was guided and it was mostly instruction on both procedural and conceptual knowledge. Since there was no independent practice during this portion of the research, I looked towards the project to let me know how well the students were picking up the procedures and concepts.
The project in my eyes was a success for two main reasons: the students had a fantastic time working on the project and that enjoyed what they were doing and learning, as well as that by the end of the week the students were developing a genuine concept of percent. Looking at the exit slip/surveys where each day they defined percent, at the end of the project they were providing some great responses to what percent was, much further beyond where they were at the start of the week. During the computations in the project, students made the least amount of errors when dealing with percent. This told me was that these students were able to develop procedural and conceptual knowledge in a particular content area, and then successfully apply it within a math inquiry project.
The true test in my eyes for this project was their ability to perform on the post-test math inquiry. Knowing the difficulty they experienced on the pre-test math inquiry, I wanted to see how addressing the concept of percent might enable them to perform better on a whole for the project. As they began the math inquiry, they were extremely proficient at manipulating the data that involved percent. They were solving for the different steps and quickly executing the parts of the problem to solve. One of the students was unable to complete the math inquiry. He is a student that often is faced with attention difficulties, and I believe that during this inquiry he was having trouble focusing and entered into a passive state during class. Of the five students that finished, I was happy to see that there was much improvement in their processing ability in working with percent and completing a multi-step problem solving activity. One of the most impressive moments was when the student with the lowest ability level of the group was the first to correctly solve for the math inquiry and seeing the smile she wore on her face.
The true test in my eyes for this project was their ability to perform on the post-test math inquiry. Knowing the difficulty they experienced on the pre-test math inquiry, I wanted to see how addressing the concept of percent might enable them to perform better on a whole for the project. As they began the math inquiry, they were extremely proficient at manipulating the data that involved percent. They were solving for the different steps and quickly executing the parts of the problem to solve. One of the students was unable to complete the math inquiry. He is a student that often is faced with attention difficulties, and I believe that during this inquiry he was having trouble focusing and entered into a passive state during class. Of the five students that finished, I was happy to see that there was much improvement in their processing ability in working with percent and completing a multi-step problem solving activity. One of the most impressive moments was when the student with the lowest ability level of the group was the first to correctly solve for the math inquiry and seeing the smile she wore on her face.
